Thursday, September 26, 2013

Cost Curves in Microeconomics

Concepts of Cost

The concept of cost is very important in micro economics because it is used to find out total revenue, total cost determines the amount of profit. Therefore a firm always tries to minimize its cost. In order to produce goods, a firm uses materials and factors of production (land, labour, capital etc.) called - inputs. The expenditure incurred on these inputs is called - cost of production.

In economics, the term 'cost' is used in a variety of way such as:
  • Money cost
  • Real cost
  • Opportunity cost
  • Explicit cost
  • Implicit cost
  • Private cost
  • Social cost
  • Accounting cost and
  • Economic cost

Short - run and Long - run Cost

When economists examine firms over time they must define the short-run and long-run.
  1. Short run:
    • Only some input (e.g. labour) can be adjusted
    • Not enough time to adjust all input ( such as Capital(K))
  2. Long run:
    • Long enough time to adjust all input (K as well as Labout(L))

Short - run Total Cost

In short - run, some factors of production are fixed while some are variable. Accordingly, the costs of production of the firm in the short - run are divided into fixed costs and variable costs.

1. Total Fixed Costs (TFC)
  • Total costs of fixed factors are known as Total Fixed Costs.
  • These costs don't vary with the change in volume of output.
  • Whether the output is zero or maximum, fixed costs remain the same.
  • These costs are also known as supplementary costs or indirect costs.
  • Total fixed costs include costs like as rent, wages of permanent employees, interest on fixed capital, insurance charges and property tax.
2. Total Variable Cost (TVC)
  • Total variable costs are cost of variable factors.
  • When output changes these costs also change.
  • As the output increases, these cost also increase and vice-versa.
  • When output is zero, these costs are also zero.
  • These costs are also called Prime cost or Direct cost.
  • Total variable costs include expenses like as purchases of raw materials, wages of casual labour, expenses on electricity etc.
3. Total Cost (TC)
  • Total costs are the total expenses incurred by a firm in producing a given quantity of a commodity.
  • Total costs consist of total fixed costs (TFC) and total variable costs (TVC).
  • Hence, TC = TFC + TVC

Thursday, September 5, 2013

Monetary and Fiscal Policies (2066Q6): Discuss the main features of current monetary policy of Nepal and also examine critically the role played by Nepal Rastra Bank for sustaining monetary and financial stability in Nepal.

Main features of Current Monetary Policy of Nepal

  1. Selective Licensing policy
  2. Focus to Rural Branch of Commercial Banks
  3. Interest fee financial resource to promote the branches of bank and financial institution for district headquarters upto 50 lakhs and outside Rs. 1 crore
  4. Liberal foreign exchange management policy – 2500 USD per trip, per passport and 5000 USD whole year
  5. Compulsory Reserve Ratio is increased by 1% to commercial banks and 0.5% to development banks
  6. Deposit insurance upto 3 lakhs
  7. Facility upto 5,000 USD to draw from a/c 


Wednesday, August 7, 2013

Development Economics (2068Q10): Why financial and economic analysis is carried out? Why are private sectors interested in financial analysis and public sector in economic analysis?

Financial Analysis

It is a method used to evaluate the viability of a proposed project by assessing the value of net cash flows that result from its implementation. Such analysis are routinely carried out in private and public sectors. Private sector uses it to assess whether investment projects are commercially profitable or not. In public sector financial analysis is conducted to sold and charges imposed e.g. light urban rail, water charges, electricity charges etc. This analysis helps to assess the budgetary impact of project, for appraising PPP (Private Public Partnership) projects, large projects with complex financing structures and for assessing net return of projects developed by commercial semi-state companies.

Purpose of financial analysis

  1. Identifying and estimating financial cash flows
  2. Assessing financial sustainability
  3. Determining that part of investment cost which won't be recovered by net revenue
  4. Calculation of performance indicators such as Net Present Value (NPV), Internal Rate of Return (IRR)
  5. Assessing the funding sources such as public, private and donor partners for projects and examining the return on capital

Economic Analysis

An economic analysis such as Cost Benefit Analysis (CBA) typically considers all the social and economic impacts on society and not just the cash flows directly affecting the sponsoring body. This analysis is mainly used by the public sector in order to focus on net benefit for society.  

Purpose of economic analysis

  1. Assessing the short to medium term determinants of price developments.
  2. To find out real activity and financial conditions in the economy.
  3. To analysis the effects on cost and pricing behavior.

Why are private sectors interested in financial analysis and public sector in economic analysis?

Private sectors are just profit oriented so they are interested in financial analysis but public sector are more responsible for quality service, improvement of nationalities/citizen's work rather than profit, so public sector focuses on an economic analysis to broadly survey on people's social and economic status.

Tuesday, August 6, 2013

Financial Management (2066Q8): What is the best combination of debt and equity in capital structure management? Explain with reasons.

Best (Optimal) combination of debt and equity in capital structure management

Capital structure refers to the mixture of equity and debt finance used by the company to finance its assets. Companies may use different mixes. Some companies could be all equity financed and have no debt at all, even though others could have low levels of equity and high levels of debt.

The biggest questions on capital structure are that do structuring of capital matters for the value of organization? Whether capital structuring has any relevancy for organization's value or it is just irrelevant matter? Such type of decisions as what mixture of equity and debt capital is to have is called the financing decision.

The financing decision has a direct effect on the weighted average cost of capital (WACC). The WACC is the simple weighted average of the cost of equity and the cost of debt. The weightings are in proportion to the market values of equity and debt; therefore, as the proportions of equity and debt vary so will the WACC. Therefore the first major point to understand is that, as a company changes its capital structure (i.e. varies the mixture of equity and debt finance), it will automatically result in a change in its WACC. Latest and well agreed objective of corporate finance is maximizing shareholder's wealth. And wealth is the present value of future cash flows discounted at the investors' required return, the market value of a company is equal to the present value of its future cash flows discounted by its WACC. The lower the WACC, the higher the market value of the company because market value of the firm is calculated as future cash flows divided by WACC.

Hence for optimal or best capital structure we need lowest WACC because when the WACC is minimal, the value of the company/shareholder wealth is highest. So, finance managers make effort to find the optimal capital structure that result in the lowest WACC.

Now another big question is that what mixture of equity and debt will result in the lowest WACC. As the WACC is a simple average between the cost of equity and the cost of debt, one may simply think that the less of expensive one is to be increased the high costly should be decrease. It means that debt capital should be increased as cost of debt is cheaper than cost of equity because debt is less risky than equity and thus required return needed to compensate the debt investors is less than the required return needed to compensate the equity investors. Debt is less risky than equity, as the payment of interest is often a fixed amount and compulsory in nature and it is paid in priority to the payment of dividends, which are in fact discretionary in nature. Another reason why debt is less risky than equity is in the event of liquidation, debt holders would receive their capital repayment before shareholders as they are higher in the creditor hierarchy, as shareholders are paid out last. Debt is also cheaper than equity from a company's perspective is because of the different corporate tax treatment of interest and dividends. In profit and loss account, interest is subtracted before the tax is calculated; thus, companies get tax relief on interest. However, dividends are subtracted after the tax is calculated; therefore, companies don't get any tax relief on dividends. So, it's better to replace expensive equity with cheaper debt to reduce WACC. However, issuing more debt means that more interest is paid out of profits before shareholders can get paid their dividends. The increased interest payment increases the volatility of dividend payments to shareholders, because if the company has a poor year, the increased interest payments must still be paid, which may have an effect the company's ability to pay dividends. This increase in the volatility of dividend payment to shareholders is also called an increase in the financial risk to shareholders. If financial risk to shareholders increases, they will require a greater return to compensate them for this increased risk, thus the cost of equity will increase and this will lead to an increase in the WACC.

In summary, when trying to find the lowest WACC, we may issue more debt to replace expensive equity; this reduces WACC but more debt also increases WACC due to increase in financial risk.

Financial Management (2066Q7): What do you mean by financial derivatives? Why are they called derivatives? Highlight the main features of derivative instruments: option, swap and futures.

Financial Derivative

A derivative is a financial contract, between two or more parties, which is derived from the future value of an underlying/existing asset. Derivatives are financial assets and can be used as an item of investment portfolio. The following figure shows the asset classification with derivatives. Generally, the transactions on derivatives are carried out through private contact and in over-the-counter market but there are also exist some organized market for some derivatives securities like option exchange, future exchange etc.

Why are they called derivatives?

Because financial derivatives derive its value from the value of underlying entities such as an asset, index or interest rate which has no intrinsic value in itself.

Main features of derivative instruments

Option:

An option is a contract between two parties wherein one party grants the right to another party to purchase or sell specified asset at specified price on or before certain exercise date. The buyer pays the seller a fee called the option premium, which is also known as initial price of option. The seller grants the right to buy or sell the asset at a fixed price. The asset on which the option contract is made is called the underlying asset. Option contract is a financial asset and can be sold in market. There are organized option exchanges to facilitate and guarantee the performance of each party's in the contract.

Types of options

1. Call options and put options:
A call option gives the holder of the option the right to buy an asset by a certain date for a certain price. A put option gives the holder of the option the right to sell an asset by a certain date for a certain price.

2. American and European options:

Features

  • The buyer has right to buy or sell the asset.
  • To acquire the right of an option, the buyer must pay a price called option price or premium.
  • The exercise price is also called fixed price or strike price or strike and is determined at the beginning of the transaction.
  • The expiration date is final date that the option holder has to exercise his right to buy or sell the underlying asset.
  • There are organized option exchanges to facilitate and guarantee the performance of each party's in the contract.

Swap

A swap is an agreement between two parties to exchange sets of cash flows over a period in the future. The payments from one party to another are based on some specific principal amount. One party pays certain percent of this amount and another party pays another percent on this amount at each payment date. This amount is called notional principal. The parties that agree to swap the cash flows are known as counter parties.

Types of Swap

1. Interest rate swap
2. Currency swap
3. Equity swap

Features

Swap contract involves the payments on different dates.
The date on which the swap contract is entered into is known as initiation date.
The date on which the swap contract terminates is called termination date.
The dates on which payments occurs are called the settlement dates.
The period between settlement dates is called the settlement period.

Futures:

Future contract or futures are exchange-traded derivatives with standardized terms. That means futures trading is organized around the concept of a futures exchange. A futures exchange is normally a corporate entity comprised of member.

Features

  • Future contracts are standardized in terms of quantity, expiration date and settlement procedures. Only price is negotiated and maturity dates are limited.
  • Future contracts are more liquid than forwarded contracts.
  • There is less default risk in the futures contract because the exchanges clearing house guarantees all payments of profits.
  • It needs security deposits initially and marking to the market regularly.
  • Futures are notional commitments to future transactions.
  • They are exchange-traded contracts.
  • Transactions on futures contracts are fully transparent.

Financial Management (2066Q6) What do you know about the financial sector reforms in Nepal? Highlight the nature, need and implications of such reforms.

Nature of financial sector reform in Nepal

Nepalese economy was liberalized since mid 1980's. Even though, Nepal Bank Limited (NBL) in 1937 was the first bank in Nepal that provided financial services to the general public. Nepal Rastra Bank (NRB), the central bank of Nepal was established in 1956 under the NRB act 1955. Nepal Arab Bank Limited was the first joint-venture bank of Nepal established in 1984, under the Government's liberalized policy. After then, three institutions of diverse nature were established under the full ownership of Government of Nepal. They were Nepal Industrial Development Corporation (NIDC in 1959), Rastriya Banijya Bank (RBB in 1966) and Agriculture Development Bank, Nepal (ADB/N in 1968). Weak supervisory and policy measures failed to address the fundamental problems of three state-owned banks (NBL, RBB and ADB/N). So, it is realized to revitalize, reform and modernizing the financial sector because a large pie of the financial sector is accounted by NBL, RBB and ADB/N. The share of NBL and RBB was 43.7% and 39.4% in the entire commercial banking sector deposit and lending activities in 2002.

Need of financial sector reform in Nepal

Organization for Economic Co-operation and Development (OECD) Performance Audit Report  May 17, 1995 concluded the basic causes of weakness of financial sectors as:
a. The lack of commitment by the Government
b. No significant changes in the managerial culture to ensure professionalism, autonomy and accountability
c. Fundamental reforms to achieve a major improvement in financial and operational performance of the banks were not specified

Similarly, KPMG/Barents study 1999/2000 was performed to find out the actual position of NBL and RBB
a. Bank's management basically dysfunctional (बेकार)
b. No reliable data on loan portfolio
c. Financial accounting is primitive and not in international standards
d. Business strategies are not in place
e. Human resource policy is weak and counterproductive
f. MIS and record keeping are very basic
g. Governance and management are politically driven

Implications of financial sector reform in Nepal

To develop a healthier financial sector in Nepal, the Second Financial Sector Restructuring Project (SFSRP) was approved by World Bank board by March 9, 2004. The four components of this project are:-
1. Voluntary Retirement Schemes
2. Hiring of Sales Advisors
3. On-going Nepal Rastra Bank Re-engineering
4. Management Team Support

After completion of this project, right now the current status of NBL and RBBL are as follows:-

NBL

  • It is under the reform program since 2058 Chaitra 1st
  • It consists 116 computerized and network branches
  • 2790 employees as in 2069 B.S.
  • Issues 1:9.5 right shares to comply with the capital regulation for commercial banks
  • Government's proportion in right share amounting to NPR. 1392.4451 million has already been received

RBBL

  • Professional management team started to work since Jan 16, 2003
  • 141 network branches having Pumori III CBS System
  • 2600 employees are working
  • Recent capital adequacy ratio is -2.44%
  • Government's proportion in right share amounting to NPR. 1392.4451 million has already been received


Sunday, August 4, 2013

Financial Management (2066Q5): What do you mean by financial statement analysis? Shed light on the ratio analysis technique with examples of at least fie major ratios.

Financial Statement Analysis

It is a process of understanding the risk and profitability of a company by analyzing reported financial information, especially annual and quarterly reports. Financial statement analysis is a study about accounting ratios among various items included in the balance sheet such as asset utilization ratios, profitability ratios, leverage ratios, liquidity ratios and valuation ratios. Financial statement analysis can also define as a quantifying method for determining the past, current and prospective performance of a company.

Advantages:

1. It provides ideas to investors to decide on investing their funds in a particular company or not.
2. Ensuring a company that it is following required accounting standards or not.
3. It is helpful to the government agencies in analyzing taxes on any firm.
4. To analyze a company's performance over a specific time period.

Limitations:

1. Difficult to compare financial data and ratios between companies.

Ratio analysis techniques:

A. Current ratio:
Current ratio = current assets / current liabilities

B. Quick ratio:
Quick ratio = (cash + marketable securities + net receivables) / current liabilities

The main difference between current ratio and quick ratio is that quick ratio includes inventories too.

C. Debt to asset ratio = total liabilities / total assets
D. Debt – equity ratio = long – term debt / shareholder's equity
E. Return on Asset = net income / total average assets
F. Return on Equity = net income / total stockholders equity

Some commonly used financial ratios:

1. Liquidity Measurement Ratios
a. Current ratio
b. Quick ratio
c. Cash ratio
d. Cash conversion cycle

2. Profitability Indicator Ratios
a. Profit margin analysis
b. Effective tax rate
c. Return on assets
d. Return on equity
e. Return on capital employed

3. Debt Ratios
a. Overview of debt
b. Debt ratio
c. Debt-equity ratio
d. Capitalization ratio
e. Interest coverage ratio
f. Cash flow to debt ratio

4. Operating Performance Ratios
a. Fixed-asset turnover
b. Sales/Revenue per employee
c. Operating cycle

5. Cash Flow Indicator Ratios
a. Operating cash flow/ sales ratio
b. Free cash flow/ operating cash ratio
        c. Cash flow coverage ratio
        d. Dividend payout ratio

6. Investment Valuation Ratios
a. Per share data
b. Price/book value ratio
c. Cash flow coverage ratio
d. Price/Earnings ratio
e. Price/Earnings to growth ratio
f. Price/Sales ratio
g. Dividend Yield
h. Enterprise value multiple

Thursday, August 1, 2013

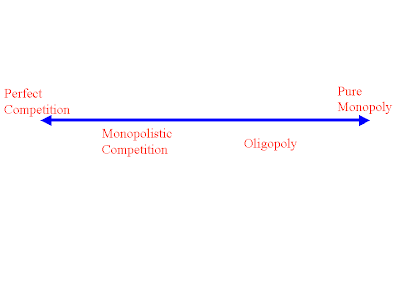
Microeconomics (2067Q4): What is perfect competition? Distinguish it clearly from monopolistic competition and pure monopoly.

Perfect Competition


It is the market structure in which there are large number of buyers and sellers of a homogeneous product. So, an individual buyer or seller doesn't have market power. It is extreme case of competitive structure in which each firm has zero market power i.e. the firm is only price taker.

Features/Assumptions of Perfect Competition

1.     Large number of sellers and buyers
2.     Product homogeneity of every firms
3.     Free entry and exit of firms
4.     Profit maximization is the main objective of all firms
5.     No government regulation
6.     Perfect mobility of factors of production
7.     Perfect knowledge of market among the sellers and buyers


Differences between Perfect Competition and Monopoly

Perfect Competition
  1. No. of sellers and buyers are very large i.e. infinite. The price of commodity is determined by the market forces of demand and supply and firm is price taker.
  2. Both AR and MR are represented by a same straight line parallel to output axis. i.e. the demand curve of a firm is perfectly elastic.
  3. In equilibrium MC=MR=AR
  4. In equilibrium MC must cut MR by its rising part.
  5. In long-run, there is normal profit to the firms due to free entry and exit of the firms in the industry.
  6. The long run equilibrium rests on AR=MR=LAC=LMC=SAC=SMC=P
Monopoly
  1. Only one firm. The firm behaves as industry and monopolist has right to fix the price level as he leaves the market to determine the quantity of output.
  2. Both AR and MR fall downward from left to right and AR>MR. The demand curve shows higher the price lower the demand.
  3. In equilibrium MC=MR and AR>MR
  4. In equilibrium MC may cut MR by its rising, falling or constant part.
  5. In long run, there is super normal profit due to strong barrier to entry of new firms.
  6. The long run equilibrium rests on SMC=LMC=MR
Monopolistic
  1. No. of sellers and buyers are large but smaller than in perfect competition. The price of commodity is determined by the market forces of demand and supply and firm is price taker. However, the market power is lower than as in monopoly  but higher than as in perfect competition.
  2. Both AR and MR fall downward from left to right and AR>MR. The demand curve shows higher the price lower the demand.
  3. In equilibrium MC=MR and AR>MR
  4. In equilibrium MC curve cuts MR curve from below.
  5. In long-run, there is only normal profit to the firms and no firm can get super normal profit. It's due to free entry of the firms in the industry.
  6. The long run equilibrium rests on LMC=MR and Price (AR) = LAC but > LMC

Wednesday, July 31, 2013

Microeconomics (2067Q3): What is meant by "Consumer's Equilibrium"? How would the equilibrium of a consumer in respect of a particular commodity be affected if (a) the price of that commodity rise, (b) the income of the consumer falls, and (c) the price of a substitute commodity falls? Use indifference curve technique for the answer.

Consumer's Equilibrium


Consumer's equilibrium is a state of the consumer at which he will get maximum satisfaction from the purchase of different available goods and services with his limited amount of money. Hicks and Allen developed IC to demonstrate the situation of consumer's equilibrium graphically with the help of budget line. 

Effects on Consumer's Equilibrium – using indifference curve technique
a. Price of commodity rise
It changes in the price of that commodity and the budget line of consumer. If income is held constant, and the price of that commodity changes then the slope of curve will change. If the price increases, the budget line will move inwards.

Here in figure, if price of Apples increases from Rs. 6 per unit to Rs. 12 per unit, then for a budget of Rs. 24, price line will shift inward to L3­­. If price of Apples decreases from Rs. 6 to Rs. 4 per unit, then for a budget of Rs. 24, price line will shift outward to L2.

b. Income of consumer falls
If consumer's income increases then he will be able to purchase higher combinations of goods. Hence an increase in consumer's income will result in a shift in the budget line. If the prices of two goods have remained same, then the increase in income will result in a parallel shift in the budget line.
As in figure below, if budget (income) of consumer increases to Rs. 36, then budget line will shift outward to L2. Similarly, if income reduces to Rs. 12, then budget line will shift inward to L3

 c. Price of a substitute commodity falls

Substitution effect means if utility held constant, as the price of the good increases, consumers substitute other, relatively cheaper goods for that one. So, if the price of substitute commodity falls then consumer switches to new commodity rather than recently using one.

There are two methods to measure substitution effect:
i. Slutsky's Measure
 As in figure above, if the price of a substitute commodity falls, then movement from D to F will be the substitution effect. That means, the consumers substitute the consuming commodity at point D by point F and MN is the effect shown by substitution.


ii. Hicks Measure
Same as in Slutsky's approach but here one curve is removed for analyzing substitution effect as well as price effect.

Microeconomics (2067Q2): What are the characteristics of Indifference Curve? How it is superior to the traditional Demand Curve?

Characteristics of Indifference Curve (IC)

  1. The slope of IC is negative i.e. it slope downwards from left to right. For example, if the quantity of one commodity is increased, the quantity of other commodity must be decreased in order to stay at the same level of satisfaction.
  2. ICs are convex to origin.
  3. ICs don't intersect each other. If they did, the point of intersection would imply different level of satisfaction which is not possible from the definition itself and from the assumption of "transitivity".
  4. Higher IC represents higher level of satisfaction. It means – the further away an IC from the origin, higher the level of utility it demonstrates.

Indifference Curve (IC) is superior to the traditional Demand Curve due to following reasons:

  1. IC analysis is more realistic in measuring utility.
  2. Free from the defect of independent utility.
  3. Free from unrealistic assumption of constant marginal utility of money.
  4. Based on less assumption.
  5. Explanation of income and substitution effects.
  6. Explanation of Giffen's Paradox.

Sunday, July 28, 2013

Microeconomics (2066Q4): Explain the nature of the cost curves. How is the long run average cost curve derived?

Qunatity
TFC
TVC
TC
AFC
AVC
ATC
MC
0
60
0
60
-
-
-
-
1
60
20
80
60
20
80
20
2
60
30
90
30
15
45
10
3
60
45
105
20
15
35
15
4
60
80
140
15
20
35
35
5
60
135
195
12
27
39
55


·        AFC is a continuously decreasing function
·        AVC & ATC curves are U-shaped
·        The vertical distance between ATC & AVC at each output level is equal to AFC
·        MC crosses both AVC & ATC from below at their respective minimums
·        MC is not affected by fixed costs

Relationship between AC and MC
·        When MC<AC, AC is falling
·        When MC=AC, AC is minimum
·        When MC>AC, AC is rising
·        The minimum point of MC always comes before the minimum point of AC
·        When MC is falling AC cannot rise, it must also fall.

Derivation of long run average cost curve
In the long run, all inputs (factors of production) are variable and firms can enter or exit any industry or market. Consequently, a firm's output and costs are unconstrained in the sense that the firm can produce any output level it chooses by employing the needed quantities of inputs (such as labor and capital) and incurring the total costs of producing that output level.
The Long Run Average Cost, LRAC, curve of a firm shows the minimum or lowest average total cost at which a firm can produce any given level of output in the long run (when all inputs are variable).
Explanation

In the long run, all inputs (factors of production) are variable and firms can enter or exit any industry or market.
Assumption - A firm is uncertain about the demand in the long run and is considering four alternate plants. The short run curves are given by SAC1, SAC2, SAC3 and SAC4.
Look at the following figure. In this figure, we have 4 short run curves SAC1, SAC2, SAC3 and SAC4.
·        To produce Q0, The firm will use SAC1 curve. At this output cost is P0
·        To produce Q1, The firm will again use SAC1 curve. At this output cost is P0
·        To produce Q2, The firm will use SAC2 curve. If it will continue to use SAC1 curve, then the cost will increase to P2. So, it would be better for the firm to bring second plant into the production.
·        At SAC2 curve, the cost of producing Q2 would be P1, much less than P2
·        Lets see Q3: to Produce Q3, firm can either use SAC3 or SAC4 curve.
·        For Q3, the firm will use SAC4 curve, as it has low cost.
·        For Q3, the cost of producing at SAC3 is much higher than SAC4.
In the long run, a firm will use the level of inputs that can produce a given level of output at the lowest possible average cost. Consequently, the LRAC curve is the envelope of the short run average cost (SAC) curves, where each SRAC curve is defined by a specific quantity of inputs
The Long Run Cost Function describes the least-cost method of producing a given amount of output. The "Long Run" part of the cost function means that all inputs are variable. In the simple case, you'd consider capital and labor. In the long run, both capital and labor may be adjusted. In the short-run, however, capital may not be adjusted. (You can't buy and install new machinery by next week, or sell a factory and be moved out.) You can, however, hire new employees to start work tomorrow..
Summary
·        In the long run all inputs are flexible, while in the short run some inputs are not flexible, long-run cost will always be less than or equal to short-run cost.
·        In the short run the firm faces an additional constraint: all expansion must proceed using only the variable input. And additional constraints increase cost.

·        The envelope relationship is the relationship explaining that, at the planned output level, short-run average total cost equals long-run average total cost, but at all other levels of output; short-run average total cost is higher than long-run average total cost.

Preeti to Unicode Converter